




If you grew up watching sports the way I did, you probably remember when “analysis” meant a guy in a suit circling a player on a telestrator and saying something like, “He just wanted it more.”
And honestly. Sometimes that was true.
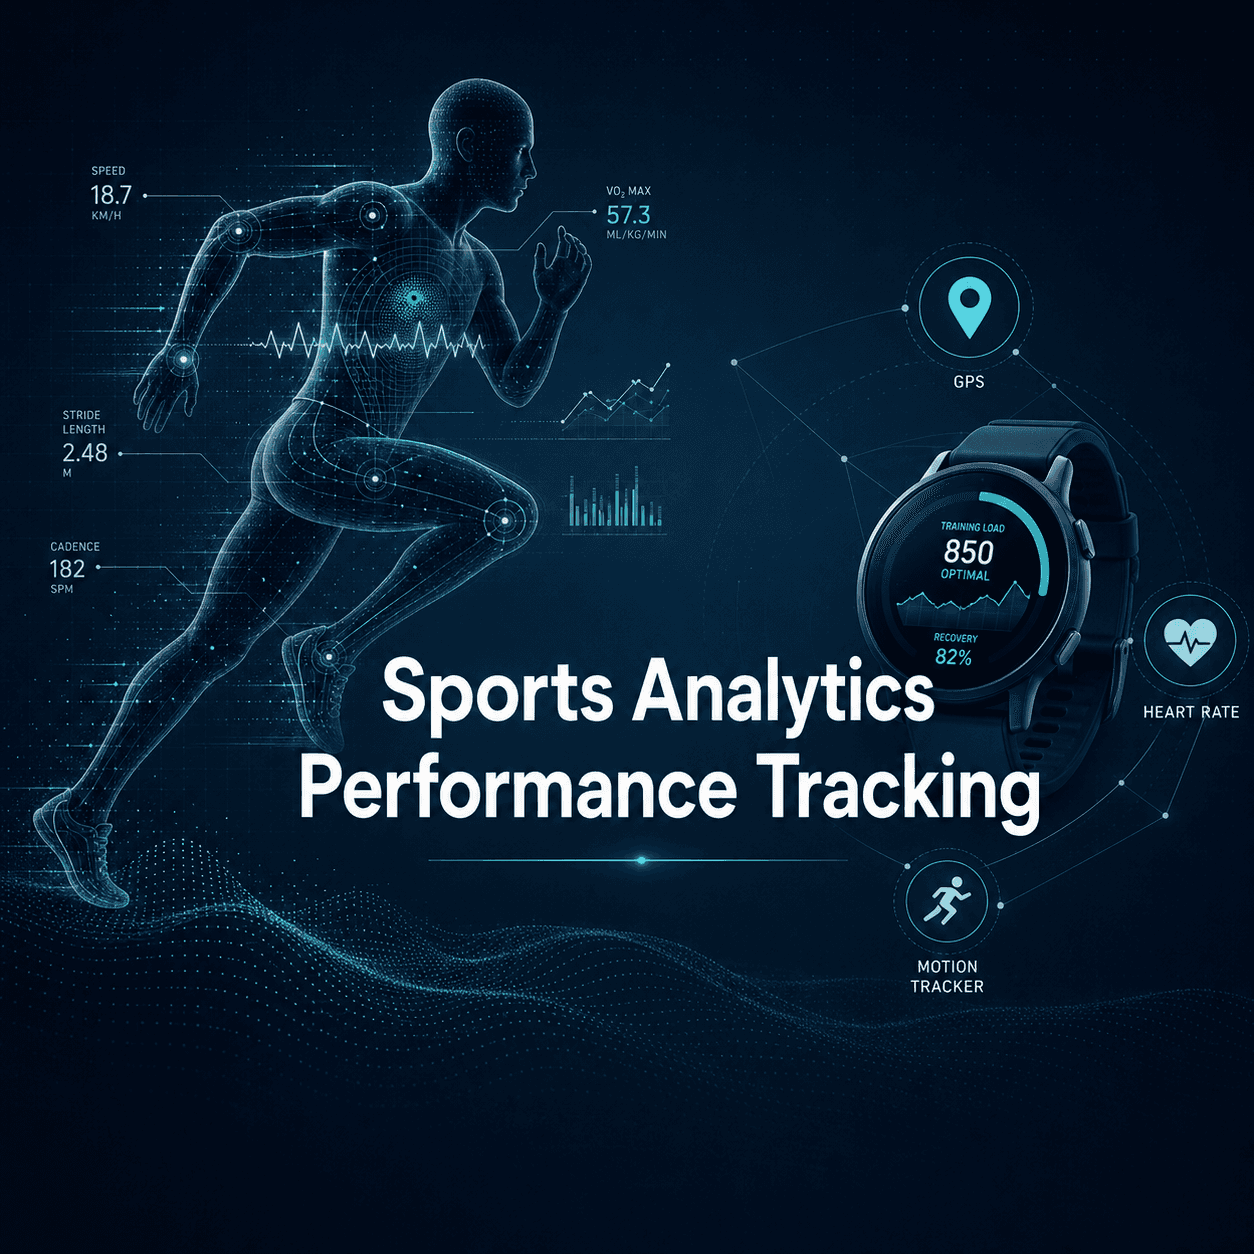
But somewhere along the way, sports started getting… measured. Like, aggressively measured. Every sprint, every cut, heart rate spikes, sleep quality, how many meters someone covered “at high intensity,” even how quickly a player decelerates before changing direction.
Now you watch a broadcast and they’ll flash a graphic that says a winger hit 36.2 km/h and your brain goes, cool, but also. How do they even know that.
This is the evolution of sports analytics and performance tracking. Not just the moneyball stuff. The whole thing. The slow creep from notebooks and gut feel into sensors, computer vision, machine learning models, and performance departments that look more like small labs than a coach’s office.
Let’s walk through it.
The early days: box scores, clipboards, and vibes
For a long time, the data in sports was basically whatever you could write down without missing the game.
Baseball had box scores and a culture of record keeping, so it kind of got a head start. Basketball had points, rebounds, assists, maybe steals and blocks later. Soccer had goals and maybe shots if you were lucky. Football had yards and completions. Hockey had goals, assists, plus minus.
And that was enough to tell stories, but it didn’t really explain performance. It told you what happened, not why it happened.
Coaches relied on experience and pattern recognition. Scouts had their own internal models, except it was mostly in their heads.
Some of that human judgment is still valuable, by the way. The problem was the lack of repeatability. Two scouts could watch the same player and come away with totally different opinions, and neither could prove much beyond “trust me.”
So the first big shift was simply: start tracking more things, consistently.
Moneyball and the idea that numbers can beat intuition
When people say “sports analytics,” a lot of them mean baseball and the Moneyball era.
The famous idea wasn’t just on base percentage. It was the bigger concept: the market is inefficient, and if you can measure things better than other teams, you can win more games per dollar.
Baseball was perfect for this. Discrete events. Lots of games. Tons of historical data. Less chaos compared to open flow sports.
Front offices started hiring analysts. Spreadsheets became weapons. Traditional stats got questioned, then replaced, then rebuilt into something more predictive.
This mindset spread fast.
Basketball leaned into shot location data and efficiency. Football started measuring things like expected points added. Soccer began building models for expected goals, shot quality, and pressing. Hockey started talking about shot attempts and possession proxies.
The big step here is important: teams stopped using stats just to describe the past. They started using data to make decisions.
Recruiting decisions. Lineup decisions. Strategy. Training priorities.
And then tracking technology showed up and changed the whole conversation again.
From “what happened” to “how it happened”: the tracking revolution
Traditional analytics mostly came from event data. Someone took notes, manually or semi manually, and logged actions.
But performance tracking is different. It’s continuous. It’s physical. It tells you what the athlete’s body did, moment by moment.
Two big streams emerged:
- Wearable sensors (GPS and inertial sensors)
- Optical tracking (cameras and computer vision)
GPS vests and the rise of “player load”
In the 2000s and early 2010s, GPS wearables became common in training, especially in soccer, rugby, Australian rules football, and eventually many other sports.
Players would wear a little unit in a vest between the shoulder blades. It tracked:
- Distance covered
- Speed and sprint distance
- Accelerations and decelerations
- High intensity running
- Positioning, to some extent
- Sometimes heart rate via chest straps or integrated sensors
Then teams started building internal metrics. You’ve probably heard terms like “player load,” “acute chronic workload ratio,” “high speed efforts,” “metabolic power.”
Some of these were helpful. Some got overhyped.
But the direction was clear: performance departments wanted objective signals of fatigue, readiness, and injury risk.
And this was where sports started feeling like a science project. In a good way. And sometimes in a slightly terrifying way if you’re the athlete.
Because once your training is measured, it can be managed. But it can also be judged.
Optical tracking and the “everyone is a data point” era
Wearables are great, but not every sport can use them in competition. Basketball games, for example, have restrictions and practical issues. Same with many leagues that don’t allow devices during official matches.
Optical tracking solved that.
Systems like multi camera setups in arenas and stadiums could track every player and the ball. This enabled:
- Spacing and formation analysis
- Defensive coverage mapping
- Off ball movement metrics
- Passing lanes and decision speed
- Team shape and compactness
- Possession value models
And the best part for teams. No one has to wear anything.
Once you have x,y coordinates for players across time, you can start computing almost anything. It’s like going from a still photo to a full movie with coordinates attached.
This is also where analytics shifted from being mostly a front office thing to being something coaches actually could use day to day.
Because now you could answer questions that matter tactically.
Not just “how many shots.” But “how did we create them.” Or “why are we conceding transitions.” Or “who is breaking our pressing structure.”
The advent of such technologies has led to an increased understanding of player load, which refers to the total training stress experienced by an athlete during a specific period.
Performance tracking becomes a department, not a gadget
At first, tracking tech was a toy for some teams. Then it became an edge. Then it became standard.
And once everyone has the tech, the advantage moves again.
It’s not about owning GPS units. It’s about what you do with the data.
This is where performance tracking matured into a full workflow:
1) Data collection
- GPS and accelerometers in training
- Heart rate monitoring
- Force plates for jump testing and asymmetry checks
- Timing gates for sprint testing
- Wellness questionnaires
- Sleep tracking (sometimes via wearables)
- Video and optical tracking
- Strength training logs and velocity based training data
A modern pro athlete might generate a ridiculous amount of data without realizing it.
2) Data cleaning and context
Raw numbers are messy. GPS can drop signal. Optical tracking can mislabel. Heart rate sensors slip. Athletes forget to answer wellness forms. Some days are travel days. Some are altitude. Some are “coach decided to run double.”
If you don’t add context, you get fake precision.
This is the part fans rarely see. The unglamorous work. But it’s the difference between useful insights and nonsense.
3) Modeling and interpretation
Here’s the truth. Most coaches do not care about your model if it doesn’t change an outcome.
So analysts and performance staff translate data into decisions like:
- Should this player train fully today or be modified?
- Who is at risk of overload based on recent spikes in high speed running?
- Are we hitting the physical outputs we need to play our style?
- Is the athlete recovering well across congested fixtures?
- Is the return to play progression actually safe?
This also includes tactical interpretation, which is its own universe.
4) Communication
This is where a lot of programs fail.
You can have the best tracking system in the world, but if the coach thinks it’s “sports science people overcomplicating things,” it won’t matter. If the athlete feels surveilled and not supported, it won’t matter.
The best performance departments are basically translators. They speak athlete, coach, and data at the same time.
The shift from team level stats to individual biomechanics
One of the more interesting evolutions is that analytics didn’t just go “more stats.” It went deeper into the body.
Especially with:
- IMUs (inertial measurement units)
- Force plates
- High speed cameras and markerless motion capture
- Smart insoles
- EMG in some research settings
Now you can measure things like:
- Ground contact time
- Jump takeoff mechanics
- Asymmetries between left and right leg
- Joint angles and movement signatures
- Fatigue related changes in running form
- Throwing workload in pitchers beyond simple pitch counts
This matters because injuries often show up as patterns before they show up as pain. Not always, but often enough that teams pay attention.
Also, performance improvement is sometimes about tiny changes. A degree here, a fraction of a second there, a small increase in force production.
It’s not always “get stronger.” It’s “get stronger in the right way, and don’t break.”
What analytics looks like in different sports (because it’s not one thing)
People talk about sports analytics like it’s a single field. It’s not. It’s more like a bunch of related subfields that share tools.
A few examples.
Baseball: prediction, scouting, and biomechanics
Baseball analytics is heavily model driven. Pitch design, swing decisions, batted ball quality. There’s also a deep biomechanical layer now, with motion capture labs and high speed tracking.
It’s a sport where a lot of performance is hidden in micro variables. Spin rate. Release point consistency. Bat path. Approach.
Basketball: spacing, shot quality, and decision speed
Basketball analytics evolved quickly once player tracking in arenas became common.
Shot charts were just the start. Now teams analyze:
- How screens create advantages
- How defensive rotations happen
- How quickly a player makes reads
- How lineups affect spacing and driving lanes
- How off ball movement impacts efficiency
And workload tracking is huge too, because the schedule is brutal.
Soccer: physical outputs plus tactical structure
Soccer is messy. It’s continuous. Low scoring. Lots of things matter that never show up in a box score.
So soccer analytics often combines:
- Physical data (high speed running, repeated sprints, decels)
- Tactical data (pressing, build up patterns, defensive compactness)
- Event value models (expected goals, expected threat, possession value)
And performance tracking is used constantly to manage training load across long seasons.
American football: play level modeling and injury management
Football is play by play and high collision.
Analytics includes:
- Play calling tendencies and efficiency
- Player evaluation and roster building
- Tracking data for separation, speed, and positioning
- Load management, especially soft tissue injuries in skill positions
- Return to play decisions, which are complicated in a contact sport
Where AI and machine learning actually helped (and where it’s mostly hype)
Machine learning has been part of sports analytics for a while, but the public conversation exploded recently because AI became a mainstream word.
Here’s a grounded way to see it.
AI helped most in areas like:
- Pattern recognition in tracking data
- Automating video tagging and event detection
- Forecasting workloads and fatigue markers
- Computer vision for markerless motion capture
- Clustering player styles for scouting and recruitment
- Optimizing training plans with constraints
But there’s also hype.
If someone tells you an AI model can “predict injuries” in a clean, universal way, be skeptical. Injuries are multi factor. Sleep, stress, prior history, tissue capacity, technique, luck. The data is incomplete. And teams have small sample sizes relative to the complexity.
What models can do, more realistically, is flag elevated risk or detect unusual patterns that prompt human review.
AI is a very good assistant. It’s rarely a perfect oracle.
The cultural tension: data vs coaches, and why it’s getting better
There was a period where analytics and coaching felt like enemies.
The stereotype was:
- Analysts: “The numbers say you’re wrong.”
- Coaches: “The numbers don’t understand the game.”
Both sides were kind of right.
Data without domain understanding becomes silly fast. You can optimize the wrong thing. You can miss the human element. You can miss context.
But intuition without measurement can also be biased, inconsistent, and slow to adapt.
The best modern programs blend them.
A good coach asks better questions because of the data. A good analyst builds better models because of the coach.
And athletes, in the middle, just want one thing. Help me perform. Keep me healthy. Don’t drown me in charts.
Fans see more data now, but teams are still way ahead
Broadcasts show tracking overlays, speed numbers, expected goals, win probability, all that.
That’s the public layer.
Behind the scenes, teams often have proprietary data pipelines and custom metrics built for their style of play, their roster, their injury history, their coaching preferences.
Also, the competitive edge isn’t just the model.
It’s the process.
- How quickly insights reach the staff
- How clearly it’s communicated
- Whether the athlete buys in
- Whether decisions are actually made from it
- Whether you learn from outcomes and iterate
A team with average models and excellent process can beat a team with fancy models and terrible implementation.
Privacy, ethics, and the uncomfortable side of tracking
This part matters more every year.
If an athlete’s sleep, heart rate variability, stress markers, and movement patterns are tracked daily, who owns that data?
- The player?
- The team?
- The league?
- The wearable company?
What happens in contract negotiations? Does a team use tracking data to label a player “injury prone” and lower offers? Does a player hide data to protect themselves?
Even inside a team, there’s the question of access. Does every coach see everything? Does management see medical related indicators?
The ethical best practice is clear boundaries, consent, and data minimization. But in real life, it varies a lot.
And in youth sports, it gets even trickier. Parents buying tracking devices for kids. Coaches using numbers to rank teenagers. That can go sideways fast if it becomes obsession instead of support.
The next phase: real time decisions and personalized performance
So where is this going?
A few trends feel pretty locked in.
Real time analytics during games
Some sports already have real time dashboards. The direction is more of that, faster.
- Tactical adjustments based on opponent patterns detected live
- Substitution decisions informed by physical output and fatigue signals
- Automated clips delivered to coaches mid game, not after
Rules and league policies will shape how far this goes, but the appetite is obvious.
More personalization, less one size fits all training
The old model was: everyone runs the same session, maybe modified for a few guys.
The new model is trending toward individual prescriptions.
Because two players can do the same training load and respond completely differently.
So teams are moving toward:
- Individual baselines
- Individual thresholds for high speed running exposure
- Individual recovery strategies
- Training plans tuned to position demands and injury history
Better measurement without wearables
Markerless motion capture and advanced computer vision are getting better. That means more biomechanics data without suits, markers, or lab setups.
In other words, a regular camera might eventually tell you a lot about joint angles, movement efficiency, fatigue signatures.
This is powerful. Also a little creepy. But powerful.
Analytics for refereeing and rules
Tracking data is also shaping officiating and competition rules. Offside tech, goal line tech, ball tracking, foul detection.
Some of it improves fairness. Some of it sparks debates about the “spirit” of the game.
That debate will never end, by the way.
What hasn’t changed, even with all this data
Here’s the funny part.
With all the models and sensors and dashboards, the core problems are still human:
- Can the athlete execute under pressure?
- Can the team work together?
- Can you stay healthy across a season?
- Can you make the right decisions fast?
Analytics and performance tracking help, but they don’t replace those realities.
They just give you a clearer mirror.
Sometimes the mirror is brutal. Sometimes it’s liberating. Like, oh, it’s not that I’m lazy. I’m actually overloaded and not recovering. Or, oh, my sprint mechanics fall apart in the last 15 minutes. That’s fixable.
That’s the best version of this whole evolution. Not numbers for numbers’ sake. But measurement that leads to better training, smarter tactics, fewer injuries, and maybe longer careers.
And for fans. Better understanding.
Even if we still occasionally enjoy the old school explanation.
He just wanted it more.
FAQs (Frequently Asked Questions)
What was sports analysis like before the rise of advanced technology?
Before advanced technology, sports analysis mainly involved simple statistics like box scores and basic event tracking, combined with subjective opinions from coaches and scouts. Analysts relied heavily on experience and pattern recognition rather than detailed data, making it hard to explain why certain performances happened.
How did the Moneyball era change sports analytics?
The Moneyball era introduced the concept that better measurement and data analysis could outperform traditional intuition in sports decision-making. It emphasized identifying inefficiencies in player evaluation using statistics, leading teams to adopt predictive models for recruiting, lineups, strategy, and training across various sports beyond baseball.
What types of data do wearable sensors like GPS vests collect in sports?
Wearable sensors such as GPS vests track continuous physical data including distance covered, speed, sprint distance, accelerations and decelerations, high intensity running efforts, positioning to some extent, and sometimes heart rate. These metrics help quantify player load, fatigue, readiness, and injury risk during training and matches.
Why is optical tracking important in modern sports performance analysis?
Optical tracking uses multi-camera systems to capture precise x,y coordinates of players and the ball without requiring wearables during competition. This enables detailed analysis of spacing, formations, defensive coverage, off-ball movement, passing lanes, team shape, possession value models, and provides coaches with actionable tactical insights.
How has sports analytics evolved from descriptive to decision-making tools?
Sports analytics has progressed from merely describing past events with basic stats to using sophisticated data models for making informed decisions. Teams now apply analytics for recruiting players, optimizing lineups, developing game strategies, and tailoring training priorities based on predictive insights rather than just historical records.
What challenges exist with early subjective scouting compared to modern analytics?
Early scouting relied heavily on individual judgment without standardized metrics or repeatability. Different scouts could have conflicting opinions about the same player without objective proof. Modern analytics bring consistency by tracking extensive measurable data that supports evidence-based evaluations reducing bias and improving decision reliability.